Syntax Graphs
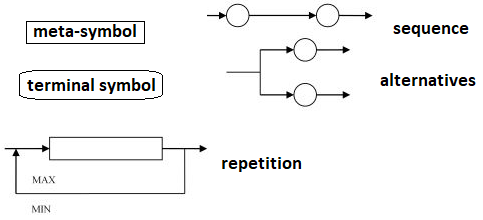
Syntactic rules can also be modeled using graphs, for example, in the following way:
The idea is to represent all possibilities of the BNF formula in some graphical way.
1. Example: Syntax Graph for Variable Declarations in the PASCAL Language
Even if someone is unfamiliar with the PASCAL language, they would be able to declare syntactically correct variables using the graph:
var age, weekdays : integer;
var taxrate, netIncome : real;
var choice, isready : boolean;
  initials, grade : char;
  name, surname : string;
This shows how graphical representations can help understand and construct syntactically correct structures in programming languages.
2. Example: Syntax Graph of the JSON (JavaScript Object Notation) Data Exchange Format with Examples
The JSON format is very important in modern information technology. By looking at examples and the syntax graph, we can understand its structure.
Simple JSON Data
{
   {"title": "Poetry Collection", "author": "Name of the Poet"}
}
This is an object that contains name-value pairs or arrays, combined in various ways. For example:
{
  "menu": {
    "id": "file",
    "value": "File",
    "popup": {
      "menuitem": [
        {"value": "New", "onclick": "CreateNewDoc()"},
        {"value": "Open", "onclick": "OpenDoc()"},
        {"value": "Close", "onclick": "CloseDoc()"}
      ]
    }
  }
}
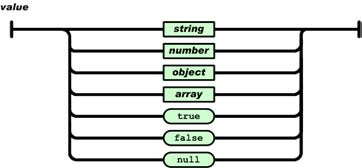
This example shows how JSON can be used to structure objects, where properties have values and methods. The syntax graph helps visualize the relationships between objects, arrays, and values.
JSON object:
JSON array:
JSON types:
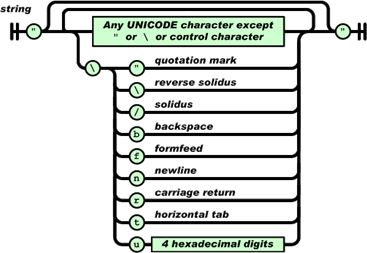
JSON string:
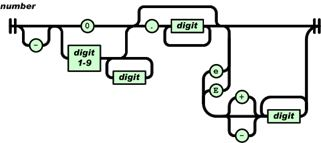
JSON number:
For example: -0.123E+10 or 12.324
Can we define JSON with BN formulas?
$$ \begin{aligned} \langle json \rangle &::= \langle value \rangle \\[6pt] % \langle value \rangle &::= \langle object \rangle \mid \langle array \rangle \mid \langle string \rangle \mid \langle number \rangle \mid \text{"true"} \mid \text{"false"} \mid \text{"null"} \\[10pt] % \langle object \rangle &::= \text{"\{"}\, \{ \langle members \rangle \}_{0}^{1}\, \text{"\}"} \\[6pt] % \langle members \rangle &::= \langle pair \rangle \{\, \text{","}\, \langle pair \rangle \}_{0}^{\infty} \\[6pt] % \langle pair \rangle &::= \langle string \rangle\, \text{":"}\, \langle value \rangle \\[10pt] % \langle array \rangle &::= \text{"["}\, \{ \langle elements \rangle \}_{0}^{1}\, \text{"]"} \\[6pt] % \langle elements \rangle &::= \langle value \rangle \{\, \text{","}\, \langle value \rangle \}_{0}^{\infty} \\[10pt] % \langle string \rangle &::= \text{"\""}\, \{ \langle character \rangle \}_{0}^{\infty}\, \text{"\""} \\[6pt] % \langle character \rangle &::= \langle unescaped \rangle \mid \text{"\textbackslash"}\, \langle escape \rangle \\[6pt] % \langle unescaped \rangle &::= \text{any Unicode char, except \{"\"", "\textbackslash", controls\}} \\[10pt] % \langle escape \rangle &::= \text{"\""} \mid \text{"\textbackslash"} \mid \text{"/"} \mid \text{"b"} \mid \text{"f"} \mid \text{"n"} \mid \text{"r"} \mid \text{"t"} \mid \langle escape\_unicode \rangle \\[10pt] % \langle escape\_unicode \rangle &::= \text{"u"}\, \{ \langle hex \rangle \}_{4}^{4} \\[10pt] % \langle number \rangle &::= \langle int \rangle\, \{ \langle frac \rangle \}_{0}^{1}\, \{ \langle exp \rangle \}_{0}^{1} \\[8pt] % \langle int \rangle &::= \text{"0"} \mid \langle onenine \rangle \{ \langle digit \rangle \}_{0}^{\infty} \\[6pt] % \langle frac \rangle &::= \text{"."} \{ \langle digit \rangle \}_{1}^{\infty} \\[6pt] % \langle exp \rangle &::= (\text{"e"} \mid \text{"E"})\, \{ \text{"+"} \mid \text{"-"} \}_{0}^{1}\, \{ \langle digit \rangle \}_{1}^{\infty} \\[10pt] % \langle digit \rangle &::= \text{"0"} \mid \langle onenine \rangle \\[6pt] % \langle onenine \rangle &::= \text{"1"} \mid \text{"2"} \mid \text{"3"} \mid \text{"4"} \mid \text{"5"} \mid \text{"6"} \mid \text{"7"} \mid \text{"8"} \mid \text{"9"} \end{aligned} $$


