tanszek:oktatas:techcomm:syntax_graphs
This is an old revision of the document!
Syntax Graphs
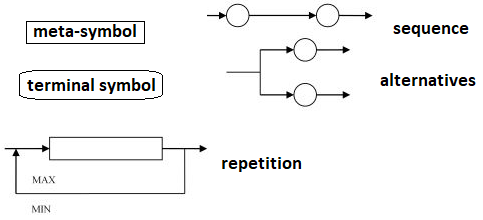
Syntactic rules can also be modeled using graphs, for example in the following way:
The idea is to represent all possibilities of the BNF formula in some graphical way.
1. Example: Syntax Graph for Variable Declarations in the PASCAL Language
Even if someone is unfamiliar with the PASCAL language, they would be able to declare syntactically correct variables based on the graph:
\[ \text{var age, weekdays : integer;} \] \[ \text{var taxrate, net\_income : real;} \] \[ \text{var choice, isready : boolean;} \] \[ \text{initials, grade : char;} \] \[ \text{name, surname : string;} \]
This shows how graphical representations can help in understanding and constructing syntactically correct structures in programming languages.
tanszek/oktatas/techcomm/syntax_graphs.1728319484.txt.gz · Last modified: 2024/10/07 16:44 by knehez


