tanszek:oktatas:techcomm:syntax_graphs
This is an old revision of the document!
Syntax Graphs
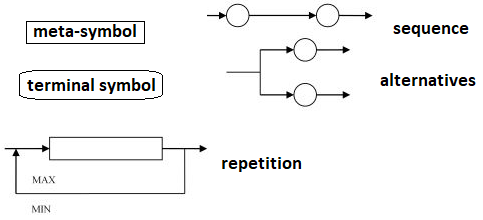
Syntactic rules can also be modeled using graphs, for example in the following way:
The idea is to represent all possibilities of the BNF formula in some graphical way.
1. Example: Syntax Graph for Variable Declarations in the PASCAL Language
Even if someone is unfamiliar with the PASCAL language, they would be able to declare syntactically correct variables using the graph:
\[ \text{var age, weekdays : integer;} \] \[ \text{var taxrate, netIncome : real;} \] \[ \text{var choice, isready : boolean;} \] \[ \text{initials, grade : char;} \] \[ \text{name, surname : string;} \]
This shows how graphical representations can help in understanding and constructing syntactically correct structures in programming languages.
tanszek/oktatas/techcomm/syntax_graphs.1728319517.txt.gz · Last modified: 2024/10/07 16:45 by knehez


